Hands-on Activity: Identifying CpG islands in long stretch of DNA#
Adapted from the CpG island detection example in Chapter 3 of Durbin et al. Biological Sequence Analysis.
Objectives#
Implement an HMM to identify CpG islands in a stretch of human genome sequence
Compare the obtained CpG islands against other functional annotations
Background#
In the previous hands-on activity, we found that the CpG dinucleotides (we write ‘’CpG’’ to emphasize that the C and G are on the same strand connected at the phospate backbone) are rare in the human genome. How about their positional distribution? Are CpGs uniformly rare throughout the genome?
One theory for why CpG is rare is that cytosines in CpG sites are easily methylated (a methyl group attaches at one of the carbons) and methylated cytosines turn into thymines at a high rate, thus resulting in a global CpG-rareness. However, there are regions of that lack methylated CpGs and are not CpG deficient. These regions are called CpG islands, and they typically coincide with gene promoters. See figure below.
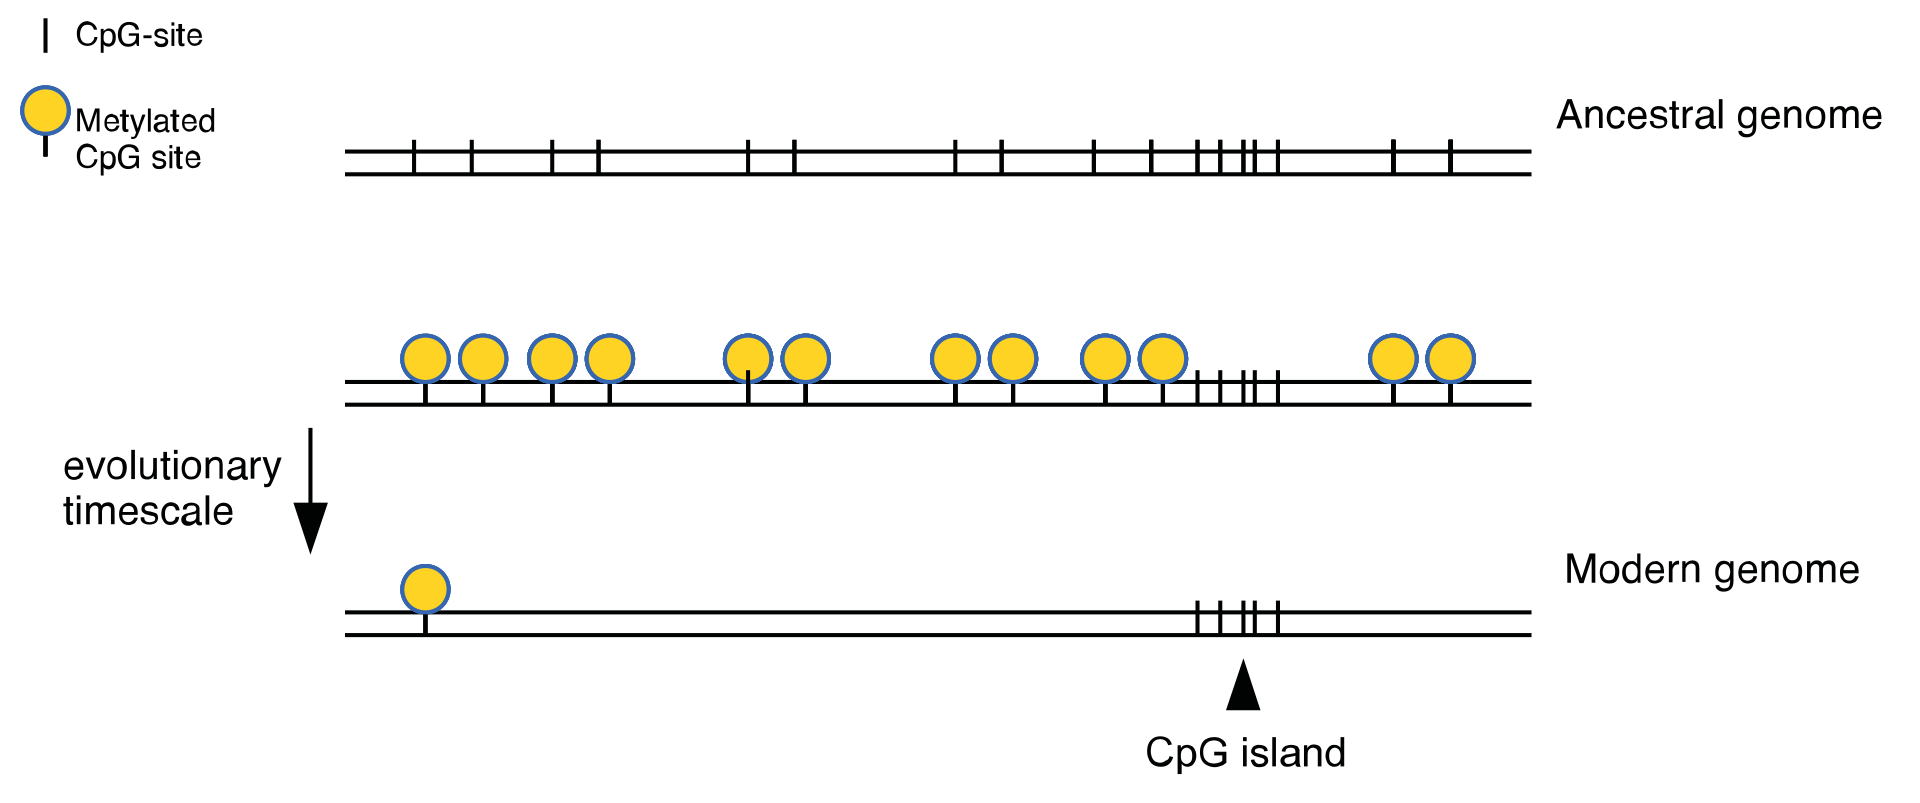
Fig. 20 CpG island
Source: https://en.wikipedia.org/wiki/CpG_site#
For more on CpG islands: https://doi.org/10.1016/j.febslet.2009.04.012 .
Let’s use an HMM to annotate a given DNA string with CpG islands and check if gene promoter regions are enriched in CpG islands.
Steps#
Specify the states of the HMM model. Use the one in Fig 3.3 of Biological Sequence Analysis by Durbin et al.
Download training data from https://genome.ucsc.edu/cgi-bin/hgIntegrator. Choose stretches of Chr18 avoiding telomeric and centromeric regions. Choose Regulation track group and CpG Islands track to get CpG island annotation.
Esimate the state transition probabilies of the model based on training data. Emission probabilities are all trivially set.
As test data, download stretches of Chr19 and the corresponding CpG island annotation and gene annotation.
Run your HMM against the test sequences. Compute Viterbi decoding and posterior decoding.
Compare your decoding to the CpG island annotation of the test data. As performance metric, you can compute a confusion matrix at per-nucletotide level. You can also check for differences in distribution of the length of the predicted and annotated islands.
Next, check if regions ~1000bp upstream of genes are enriched in CpG islands. See note below for computing statistical significance of overlap of genome annotations.
Note on computing evaluating overlap between genome annotation.#
There are several tools for computing if the overlap between two sets of annotations are statisically significant (under some random null model). Following are some options. Some tools might not be maintained, so use whatever runs.
https://bedtools.readthedocs.io/en/latest/content/tools/fisher.html
https://doi.org/10.1093/bioinformatics/btac255
https://www.sciencedirect.com/science/article/pii/S2405471219301875
References#
https://doi.org/10.1016/j.febslet.2009.04.012